文章目录
- 1、用户统计
- 2、订单统计
- 3、销量排名Top10
1、用户统计
所谓用户统计,实际上统计的是用户的数量。通过折线图来展示,上面这根蓝色线代表的是用户总量,下边这根绿色线代表的是新增用户数量,是具体到每一天。所以说用户统计主要统计两个数据,一个是总的用户数量,另外一个是新增用户数量。
原型图:

业务规则:
- 基于可视化报表的折线图展示用户数据,X轴为日期,Y轴为用户数
- 根据时间选择区间,展示每天的用户总量和新增用户量数据
接口设计
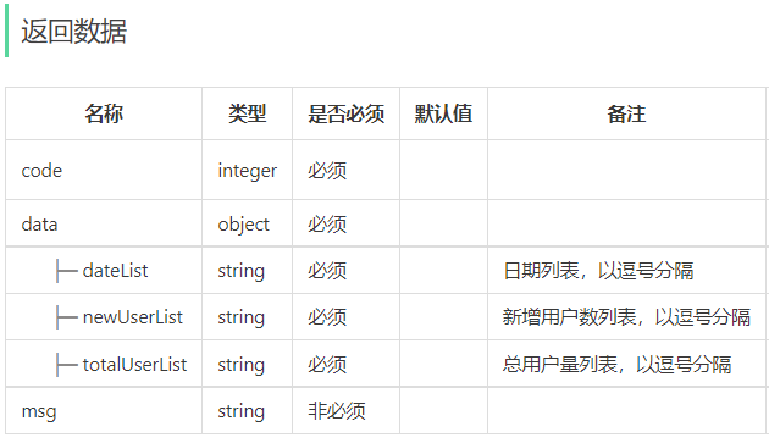
根据上述原型图设计接口。


@Data
@Builder
@NoArgsConstructor
@AllArgsConstructor
public class UserReportVO implements Serializable {

    //日期,以逗号分隔,例如:2022-10-01,2022-10-02,2022-10-03
    private String dateList;

    //用户总量,以逗号分隔,例如:200,210,220
    private String totalUserList;

    //新增用户,以逗号分隔,例如:20,21,10
    private String newUserList;

}
根据接口定义,在ReportController中创建userStatistics方法
    /**
     * 用户统计
     * @param begin
     * @param end
     * @return
     */
    @ApiOperation("用户统计")
    @GetMapping("/userStatistics")
    public Result<UserReportVO> userStatistics(
            @DateTimeFormat(pattern = "yyyy-MM-dd") LocalDate begin,
            @DateTimeFormat(pattern = "yyyy-MM-dd") LocalDate end){

        log.info("营业额统计:{},{}",begin,end);

        //调用业务获取用户统计数据
        UserReportVO userReportVO = reportService.getUserStatistics(begin,end);

        return Result.success(userReportVO);
    }
在ReportService接口中声明getUserStatistics方法
    /**
     * 用户统计数据
     * @param begin
     * @param end
     * @return
     */
    UserReportVO getUserStatistics(LocalDate begin, LocalDate end);
在ReportServiceImpl实现类中实现getUserStatistics方法
    /**
* 用户统计数据
*
* @param begin
* @param end
* @return
*/
@Override
public UserReportVO getUserStatistics(LocalDate begin, LocalDate end) {
//目标获取用户统计数据:用户每天总数量,每天新增数量 、 每天日期列表
//获取每天新增用户数量
//select count(*) from user where create_time >= 当天最小时间 and create_time <= 当天最大时间
//获取每天用户总数量
//select count(*) from user where create_time <= 当天最大时间
//1、根据开始日期与结束日期生成每天日期集合列表
List<LocalDate> dateList = getDateList(begin, end);
//2、定义存储每天新增用户 和 每天新增用户集合
ArrayList<Integer> createUserList = new ArrayList<>();
ArrayList<Integer> totalUserList = new ArrayList<>();
//3、遍历日期列表,每天数据
for (LocalDate date : dateList) {
//定义每天最大时间和最小时间
LocalDateTime beginTime = LocalDateTime.of(date, LocalTime.MIN);
LocalDateTime endTime = LocalDateTime.of(date,LocalTime.MAX);
//执行sql
//将参数封装到map里
Map<String,Object> map = new HashMap<>();
//查询总用户
map.put("endTime",endTime);
Integer totalUser = userMapper.countByMap(map);
totalUser = totalUser == null ? 0 : totalUser;
totalUserList.add(totalUser);
//查询新增用户,只需要再加一个开始条件
map.put("beginTime",beginTime);
Integer createUser = userMapper.countByMap(map);
createUser = createUser == null ? 0 : createUser;
createUserList.add(createUser);
}
//封装返回数据
return UserReportVO.builder()
.dateList(StringUtils.join(dateList,","))
.totalUserList(StringUtils.join(totalUserList,","))
.newUserList(StringUtils.join(createUserList,","))
.build();
}
在UserMapper接口中声明countByMap方法
	/**
* 根据动态条件统计用户数量
* @param map
* @return
*/
Integer countByMap(Map map);
在UserMapper.xml文件中编写动态SQL
<select id="countByMap" resultType="java.lang.Integer">
select count(id) from user
<where>
<if test="begin != null">
and create_time >= #{begin}
</if>
<if test="end != null">
and create_time <= #{end}
</if>
</where>
</select>
2、订单统计
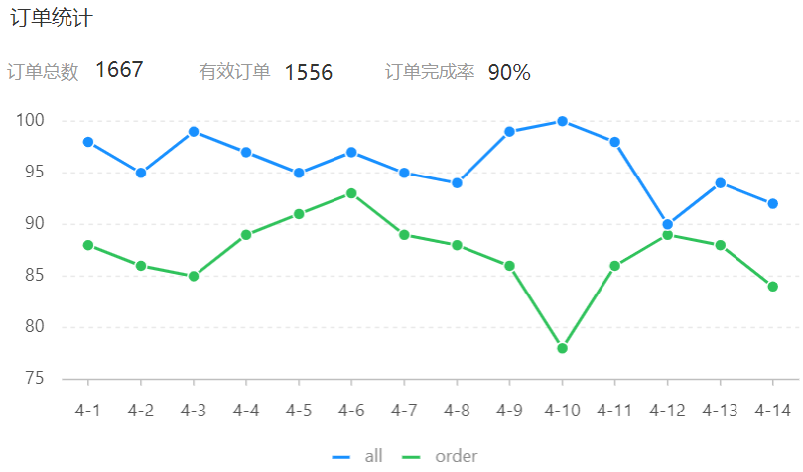
订单统计通过一个折现图来展现,折线图上有两根线,这根蓝色的线代表的是订单总数,而下边这根绿色的线代表的是有效订单数,指的就是状态是已完成的订单就属于有效订单,分别反映的是每一天的数据。上面还有3个数字,分别是订单总数、有效订单、订单完成率,它指的是整个时间区间之内总的数据。
原型图:

业务规则:
- 有效订单指状态为 “已完成” 的订单
- 基于可视化报表的折线图展示订单数据,X轴为日期,Y轴为订单数量
- 根据时间选择区间,展示每天的订单总数和有效订单数
- 展示所选时间区间内的有效订单数、总订单数、订单完成率,订单完成率 = 有效订单数 / 总订单数 * 100%
接口设计
根据上述原型图设计接口。


业务规则:
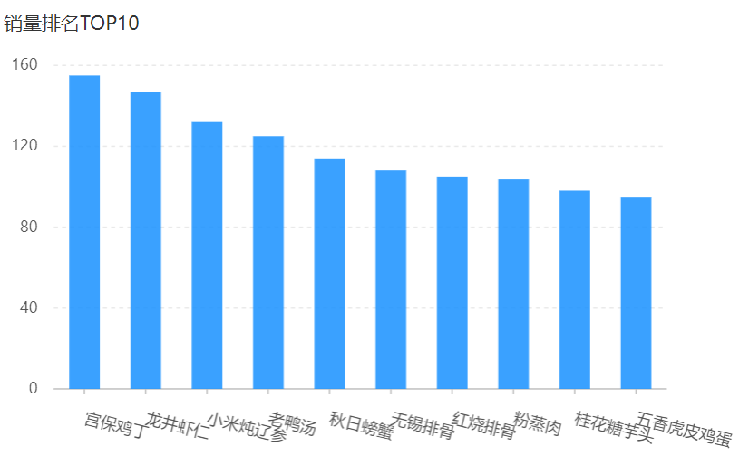
- 根据时间选择区间,展示销量前10的商品(包括菜品和套餐)
- 基于可视化报表的柱状图降序展示商品销量
- 此处的销量为商品销售的份数
接口设计
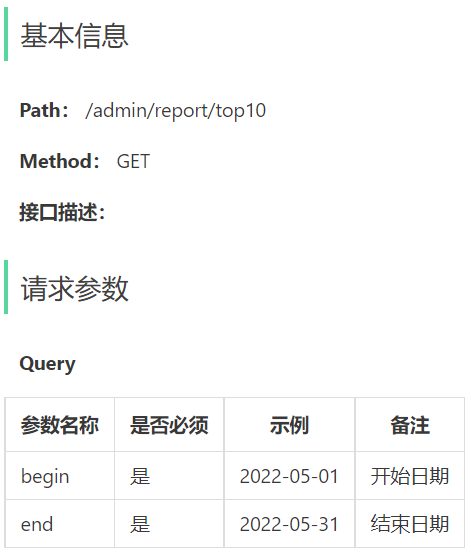
据上述原型图设计接口。


@Data
@Builder
@NoArgsConstructor
@AllArgsConstructor
public class SalesTop10ReportVO implements Serializable {
//商品名称列表,以逗号分隔,例如:鱼香肉丝,宫保鸡丁,水煮鱼
private String nameList;
//销量列表,以逗号分隔,例如:260,215,200
private String numberList;
}
Controller层
在ReportController中根据销量排名接口创建top10方法
    @ApiOperation("销售top10统计")
@GetMapping("/top10")
public Result<SalesTop10ReportVO> salesTop10Statistics(
@DateTimeFormat(pattern = "yyyy-MM-dd") LocalDate begin,
@DateTimeFormat(pattern = "yyyy-MM-dd") LocalDate end){
log.info("销售前10排名{},{}",begin,end);
SalesTop10ReportVO salesTop10ReportVO = reportService.getSalesTop10(begin,end);
return Result.success(salesTop10ReportVO);
}
Service层接口
    /**
* 销售前10统计
* @param begin
* @param end
* @return
*/
SalesTop10ReportVO getSalesTop10(LocalDate begin, LocalDate end);
接口实现类
    /**
* 销售前10统计
*
* @param begin
* @param end
* @return
*/
@Override
public SalesTop10ReportVO getSalesTop10(LocalDate begin, LocalDate end) {
//目标:top10统计:商品名称列表 List nameList,每天销量列表List numberList
//获取最大和最小时间
LocalDateTime beginTime = LocalDateTime.of(begin, LocalTime.MIN);
LocalDateTime endTime = LocalDateTime.of(end, LocalTime.MAX);
//查询top商品和销量
List<GoodsSalesDTO> goodsSalesDTOS = orderMapper.getTop10(beginTime,endTime);
//获取商品名称列表集合
List<String> nameList = goodsSalesDTOS.stream().map(GoodsSalesDTO::getName).collect(Collectors.toList());
//获取销量列表集合
List<Integer> numberList = goodsSalesDTOS.stream().map(GoodsSalesDTO::getNumber).collect(Collectors.toList());
return SalesTop10ReportVO.builder()
.nameList(StringUtils.join(nameList,","))
.numberList(StringUtils.join(numberList,","))
.build();
}
mapper层
    /**
* 获取top10
* @param beginTime
* @param endTime
* @return
*/
List<GoodsSalesDTO> getTop10(LocalDateTime beginTime, LocalDateTime endTime);
<select id="getTop10" resultType="com.sky.dto.GoodsSalesDTO">
select od.name,sum(od.number) number from orders o
inner join order_detail od on o.id = od.order_id
<where>
<if test="beginTime != null">
and order_time >= #{beginTime}
</if>
<if test="endTime != null">
and order_time <= #{endTime}
</if>
</where>
group by od.name order by number desc limit 10
</select>


